Enabling Visual Feedback
To help monitor and evaluate the progress of training deep models, you can designate a 2D rectangular region for visual feedback. With the Visual Feedback option selected, the model’s inference will be displayed in the Training dialog in real time as each epoch is completed, as shown on the screen capture below.
Training dialog

The visual feedback image for each epoch is saved during model training. You can review the result of each epoch by scrolling through the plotted graph. If the checkpoint cache is enabled, you can also save the model at a selected checkpoint when you review the training results (see Saving and Loading Model Checkpoints).
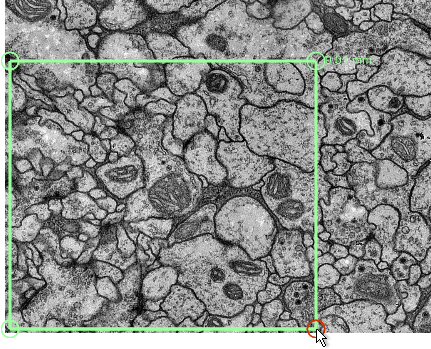
- With the Rectangle tool that is available on the Annotate panel, add a 2D rectangular region that includes the area you want to monitor during training (see Using the Region Tools).

Note Any region that you define for visual feedback should not overlap the training data.
- Do the following in the Visual feedback box on the Inputs tab:
Choose the required region in the Region drop-down menu.
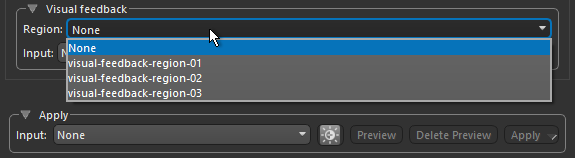
Choose a dataset for visual feedback in the Input drop-down menu, as shown below.

You can choose any dataset for visual feedback. For example, in cases in which you are using multiple training sets to train a model or if you want to monitor training progress on a dataset that is not part of your training data.